

This page shows the accumulated water year-to-date precipitation for San Diego county, all of California, and the Northern Sierra eight-station index. Water years start on October 1st and extend through the following September 30th and are numbered by the year of the January of the water year. For example, the period October 1, 2015 to September 30, 2016 is water year "2016", since the January in that period is January 2016.
Values are shown as a percent of normal (mean) accumulation found on the last day of the water year. So, values always start at zero on October 1st and increase gradually over the year (never declining). For a normal year, the value will end up at 100% at the end of the water year. A dry year will end up below 100%, and a wet year will end above 100%.
Note: Percentile values for the 1-, 2-, and 3-day changes are in percentage points of the mean accumulation in a water year, and are calculated excluding any values of zero (i.e., dry periods are not counted).
Data updated as of 2015/12/13 23:55
San Diego County
| Current: | 14.0% | 1‑day Δ: | 0.62% | 2‑day Δ: | 0.71% | 3‑day Δ: | 4.16% |
| -------- | -------- | -------- | -------- | -------- | -------- | -------- | -------- |
| (1962/12/13) | |||||||
| Rec_low: | 0.6% | 50‑ptile: | 0.50% | 50‑ptile: | 0.83% | 50‑ptile: | 1.07% |
| Typ_low: | 8.2% | 90‑ptile: | 3.80% | 90‑ptile: | 5.71% | 90‑ptile: | 7.42% |
| Mean: | 19.3% | 95‑ptile: | 5.78% | 95‑ptile: | 8.87% | 95‑ptile: | 10.63% |
| Typ_high: | 28.1% | 99‑ptile: | 10.59% | 99‑ptile: | 16.27% | 99‑ptile: | 20.54% |
| Rec_high: | 66.8% | Record: | 27.32% | Record: | 33.74% | Record: | 41.14% |
| (1965/12/13) | (1965/11/23) | (1965/11/23) | (1966/12/07) |

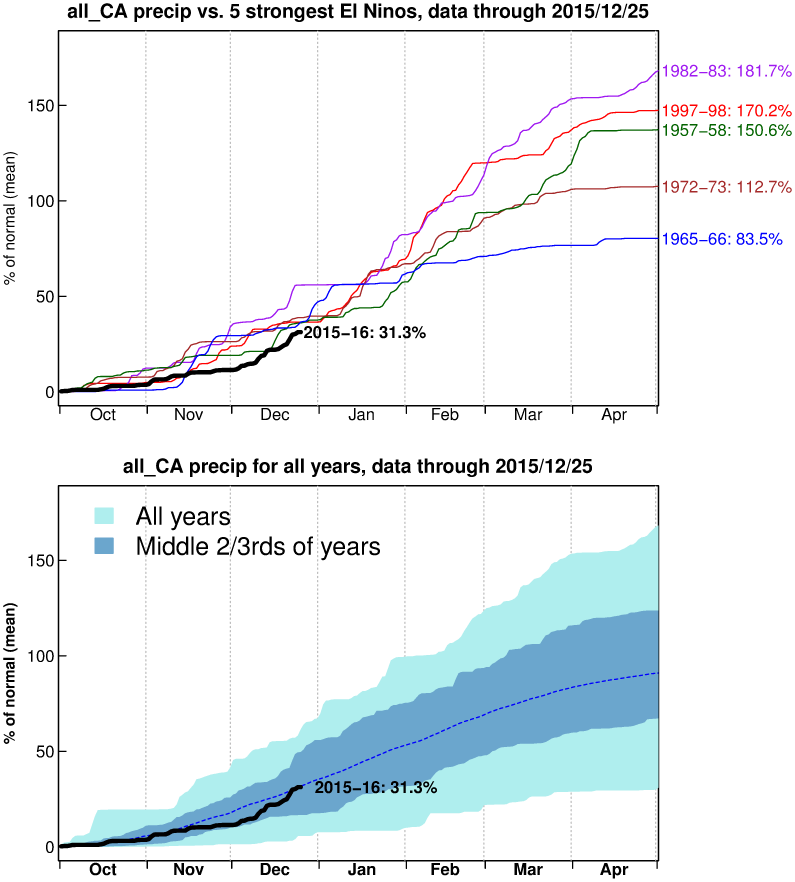
All California
| Current: | 19.2% | 1‑day Δ: | 0.04% | 2‑day Δ: | 0.46% | 3‑day Δ: | 1.96% |
| -------- | -------- | -------- | -------- | -------- | -------- | -------- | -------- |
| (1959/12/13) | |||||||
| Rec_low: | 2.8% | 50‑ptile: | 0.17% | 50‑ptile: | 0.38% | 50‑ptile: | 0.63% |
| Typ_low: | 15.2% | 90‑ptile: | 1.92% | 90‑ptile: | 3.44% | 90‑ptile: | 4.74% |
| Mean: | 24.9% | 95‑ptile: | 2.65% | 95‑ptile: | 4.62% | 95‑ptile: | 6.43% |
| Typ_high: | 33.8% | 99‑ptile: | 4.28% | 99‑ptile: | 7.58% | 99‑ptile: | 10.06% |
| Rec_high: | 52.0% | Record: | 8.05% | Record: | 15.26% | Record: | 18.69% |
| (1950/12/13) | (1955/12/23) | (1955/12/23) | (1955/12/24) |
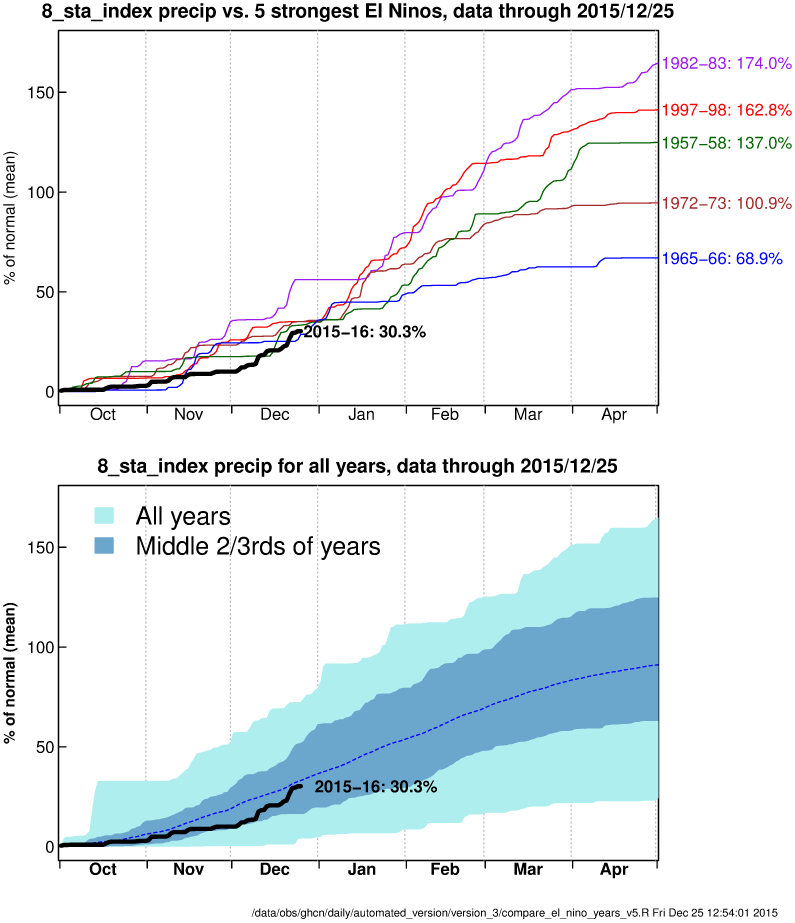
8-Station Index
| Current: | 18.4% | 1‑day Δ: | 0.00% | 2‑day Δ: | 0.14% | 3‑day Δ: | 0.90% |
| -------- | -------- | -------- | -------- | -------- | -------- | -------- | -------- |
| (1959/12/13) | |||||||
| Rec_low: | 1.1% | 50‑ptile: | 0.32% | 50‑ptile: | 0.59% | 50‑ptile: | 0.88% |
| Typ_low: | 13.5% | 90‑ptile: | 2.58% | 90‑ptile: | 4.19% | 90‑ptile: | 5.73% |
| Mean: | 26.1% | 95‑ptile: | 3.52% | 95‑ptile: | 5.91% | 95‑ptile: | 7.67% |
| Typ_high: | 37.8% | 99‑ptile: | 5.93% | 99‑ptile: | 9.46% | 99‑ptile: | 12.01% |
| Rec_high: | 64.6% | Record: | 13.60% | Record: | 20.93% | Record: | 27.37% |
| (1950/12/13) | (1964/12/22) | (1964/12/23) | (1964/12/23) |
The underlying data is primarily GHCN daily, augmented over the last few days by gauge data assembled by the California-Nevada River Forecasting Center. Accordingly, the data primarily has a daily resolution. 1-Day changes then mean the difference between the accumulated value at the beginning of the current day and the current hour of the current day. In other words, it is not a change over 24 hours, but rather the change over the current calendar day. Similarly, the 2- and 3-day changes are over calendar days, not over 48 and 72 hours, respectively.
The "typical" range encompasses the central 2/3rds of the data.
So the "typcial low" value is the 16.7th percentile value,
and the "typical high" value is the 83.3rd percentile value.