
 Home
Home
Quick Introduction
Tutorial
![]() A Few Features
A Few Features
Advanced Features
![]() Customizing
Customizing
Follow along
Want to follow along as I describe everything? Download this netcdf-format data file and let's get started.
Starting up
At the command prompt, just type "ncview" followed by the name of your netcdf file:
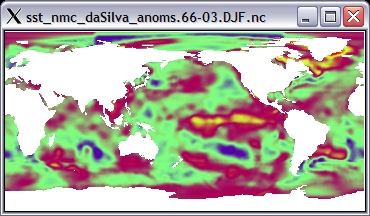
% ncview sst_nmc_daSilva_anoms.66-03.DJF.nc
Two windows will appear, the control window and the display window:
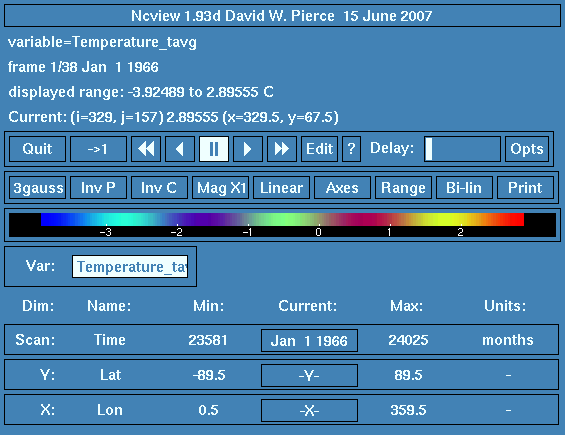
File information
The top part of the control window has information about the file. The first line displays the netCDF global attribute named "title":

In this case, the file lacks a global attribute named "title", so the version of ncview is shown instead.
The second line shows the name of the variable you are viewing:
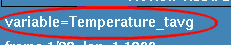
If the netCDF variable has an attribute named "long_name", the long name is displayed here instead of the regular name of the variable.
The next line shows information about the unlimited dimension of the file, which is typically time:
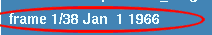
In this example, there are 38 frames (timesteps) in the file, and we are currently looking at frame 1. Additionally, we see that frame 1 corresponds to the date "Jan 1 1966". Ncview will automatically recognize and decode time units that are compatible with udunits, which have a format similar to "days since 1900-01-01".
Next we have the range of the data in the file:

Which, in this case, shows us that the most "blue" colors correspond to -3.92 C, and the most "red" colors indicate 2.89 C. Ncview knows that the units are "C" because it reads in the "units" attribute of the variable.
Last, we have the line that shows where the cursor is in the data, and the data value under the cursor:

Animating and moving in time
To animate your data, click on this button:

The display window will start showing a movie of the data. (If the movie goes too fast, slide the "Delay" slider to the right.) As the data animates,